Manufacturing leaders talk about “running lean”, “eliminating waste”, and “hitting plan”, but none of that happens without the right manufacturing KPIs. When metrics are unclear, outdated, or scattered across spreadsheets, you end up managing by instinct instead of insight.
This guide breaks down what manufacturing KPIs are, which ones actually move the needle on production efficiency, and how to build a manufacturing KPI dashboard that delivers real-time guidance instead of post-mortems.
What Are KPIs in Manufacturing?
In manufacturing, KPIs (Key Performance Indicators) are quantifiable measures that show how effectively your plant is meeting its operational and financial goals. Manufacturing KPIs track performance across production, quality, maintenance, and delivery so you can see where to intervene and how to improve.
When chosen well, manufacturing KPIs do three things:
- Give every team a shared, objective view of how the plant is performing.
- Highlight gaps between current performance and operational or financial targets.
- Show where performance is trending over time so you can spot emerging issues.
Without clear key performance indicators for manufacturing, teams chase symptoms instead of fixing root causes.
The Difference Between Manufacturing KPIs and Manufacturing Metrics
Not every number on a report is a manufacturing KPI. The distinction matters.
- Manufacturing metrics are any measures you track (for example, cycle time, scrap percentage, changeover time).
- Manufacturing KPIs are the subset of metrics that directly reflect whether you are achieving business-critical goals: output, cost, quality, and delivery.
For example:
- “Number of work orders created” is a metric.
- “Unplanned downtime as a percentage of scheduled time” is a manufacturing KPI because it directly affects manufacturing production efficiency and throughput.
When you define KPIs for manufacturing performance, start from business outcomes (on-time delivery, margin, customer satisfaction) and work backward to the minimum set of indicators needed to steer those outcomes.
Five Essential Manufacturing KPIs for Production Efficiency
Every plant is different, but five core manufacturing KPIs show up consistently in high-performing operations:
- Overall Equipment Effectiveness (OEE)
- Throughput / Output
- First Pass Yield (FPY) / Right-First-Time
- Scrap and Rework Rate
- Unplanned Downtime
These are not the only key performance indicators in manufacturing, but they form a strong foundation for tracking production efficiency and focusing on areas for improvement.
Overall Equipment Effectiveness (OEE)
OEE = Availability × Performance × Quality
- Availability: How often equipment is actually running versus scheduled time.
- Performance: How fast you run compared to the ideal cycle time.
- Quality: Good units versus total units produced.
As a manufacturing KPI, OEE summarizes multiple issues (stops, slow cycles, defects) into one number. It is also where many plants struggle because manual OEE tracking is slow and error-prone. Real-time OEE in a manufacturing KPI dashboard connected to machine data avoids this lag.
Throughput / Output
Throughput measures how many good units you produce in a defined time window (per hour, per shift, per day). This production KPI answers: “Are we producing enough to meet plan and demand?”
Throughput becomes especially powerful when viewed alongside:
- Bottleneck utilisation
- Changeover time
- Labour hours per unit
Together, these production KPIs tell you whether you are genuinely improving flow or just adding overtime to compensate.
First Pass Yield (FPY)
First Pass Yield (or Right-First-Time) measures the percentage of units that meet quality specifications without rework.
FPY = Good units produced without rework ÷ Total units produced
As a quality KPI in manufacturing, FPY reveals how much invisible waste hides behind “acceptable” final output. Plants with strong FPY typically have better profitability because they spend less on scrap, rework, and expediting replacement orders.
Scrap and Rework Rate
Scrap and rework are classic manufacturing KPI examples that tie directly to margin:
- Scrap Rate = Scrapped units ÷ Total units.
- Rework Rate = Reworked units ÷ Total units.
These key metrics for manufacturing companies highlight quality drift, process instability, or training gaps. When tied to specific machines, shifts, or recipes on a manufacturing KPI dashboard, they become a roadmap for targeted problem solving.
Unplanned Downtime
Unplanned downtime measures how often and how long critical equipment stops outside of scheduled maintenance or planned changeovers.
You can track it as:
- Minutes or hours of unplanned downtime per shift or per week
- Unplanned downtime as a percentage of scheduled time
- Number of unplanned stoppages per period
Unplanned downtime is one of the most important KPIs for manufacturing industry leaders because it hits both revenue and delivery reliability.
Why Are KPIs Important in Day-to-Day Manufacturing?
On paper, manufacturing KPIs look simple. The real value comes when they change how people work:
- Operators see whether they are on track against target rates and OEE in real time.
- Maintenance knows where breakdowns and micro-stops concentrate, enabling better planning and predictive work.
- Quality can correlate defects with specific lines, settings, or materials, not just aggregate rates.
- Leaders get a roll-up view of manufacturing key performance indicators across plants, products, or customers.
In other words, manufacturing KPIs are not just reports. They are part of a live feedback loop between the shop floor and decision-makers.
Practical Manufacturing KPI Examples That Improve Efficiency
To move beyond theory, here are concrete manufacturing KPI examples that plants use to drive production efficiency.
Availability-Focused KPIs
- Unplanned downtime (hours or percentage of schedule)
- Mean Time Between Failures (MTBF)
- Mean Time To Repair (MTTR)
These production KPIs help answer: “How reliable is our equipment, and where do we lose the most time?”
Performance-Focused KPIs
- Actual cycle time versus standard cycle time
- Line speed versus planned speed
- Units per hour (UPH) versus target
They highlight slow cycles, under-utilised equipment, and imbalance between upstream and downstream processes.
Quality KPIs in Manufacturing
- First Pass Yield (FPY)
- Defects per million opportunities (DPMO)
- Customer returns due to quality
- Cost of poor quality (COPQ)
These key performance indicators in manufacturing quality connect process performance to customer experience and margin.
Planning and Flow KPIs
- Schedule adherence
- On-time delivery to promised date
- Work in Process (WIP) inventory by stage
- Production planning KPIs such as plan versus actual output by shift or line
They show whether production planning, scheduling, and execution are aligned, or constantly in “catch-up” mode.
From Static KPI Reports to Real-Time Manufacturing KPI Dashboards
Traditional KPI reports in manufacturing are static PDF or spreadsheet summaries delivered daily, weekly, or monthly. While they provide useful hindsight, they fall short in three ways:
- Lagging information: By the time a KPI report arrives, the shift is over and the opportunity to intervene is gone.
- Manual consolidation: Engineers and supervisors spend hours collecting data from MES, ERP, SCADA, and manual logs.
- Limited visibility: Different teams maintain their own versions of KPI reports, making it hard to align on “one truth”.
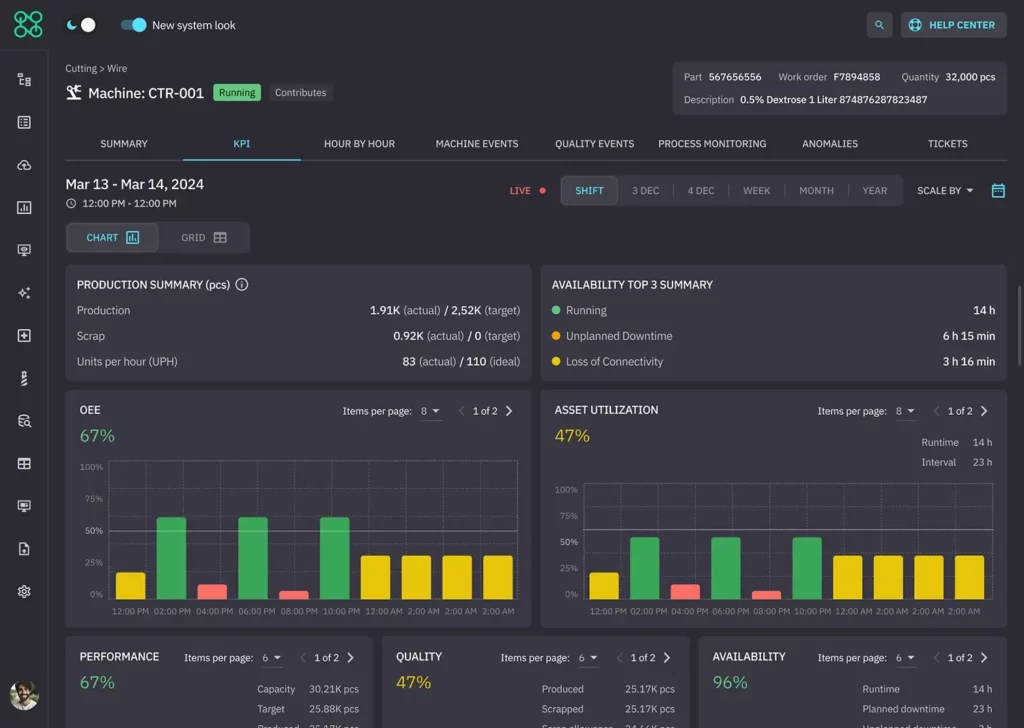
Modern KPI reports examples look very different:
- Real-time manufacturing KPI dashboards on large displays at lines and work cells.
- Role-based views for operators, maintenance, quality, and leadership.
- Drill-downs that go from a top-level manufacturing KPI (such as OEE) into specific downtime reasons or defect categories.
The goal is not more reports. It is live visibility that enables faster, more confident decisions. Solutions like Intelycx CORE support this by streaming machine-level data into unified, easy-to-interpret dashboards that update automatically.
How to Build a Manufacturing KPI Dashboard That Actually Gets Used
A manufacturing KPI dashboard should be more than a nice graphic. It should become the daily operating system for the floor.
A practical approach:
- Start with a small, critical set of KPIs
Focus on the manufacturing KPIs that matter most to your current constraints, often OEE, unplanned downtime, scrap, and throughput on a bottleneck line.
- Define clear, consistent calculations
For example, standardize OEE formulas across sites so you avoid “plant A’s OEE versus plant B’s OEE” debates.
- Connect directly to machine and system data
Use a machine connectivity platform to pull signals from legacy machines, PLCs, sensors, and existing MES or ERP systems so the dashboard updates automatically.
- Display KPIs in a clear, intuitive way
Use a KPI dashboard with simple, role-based views and a clean user interface so teams can quickly understand performance, spot issues, and draw conclusions without digging through complex charts or menus.
- Pair KPIs with actions
For each KPI for manufacturing performance, define what teams should do when a threshold is crossed (for example, escalation paths, quick response routines).
When manufacturing KPI dashboards are real-time, trusted, and tied to clear responses, they become tools for tracking production efficiency in the moment, not just after the fact.
What Toyota Teaches About KPI Manufacturing
Toyota’s approach to manufacturing KPIs focuses on a small number of simple, visible measures that expose waste and support daily problem-solving. Common examples include lead time from order to shipment, changeover time (SMED), Work in Process (WIP), First Pass Yield, and on-time delivery. The core lesson is not the exact numbers, but how consistently teams use them in practice, reviewing KPIs together, acting on gaps to target, and treating every issue as input for structured problem-solving.

How Connected Data and AI Strengthen Manufacturing KPIs
The most effective KPIs for manufacturing performance today sit on top of connected machines and AI-driven analysis, not isolated manual data collection.
A unified manufacturing KPI approach typically looks like this:
Connect machines and systems
Use a machine connectivity platform to stream real-time industrial data from legacy and modern equipment into a single source of truth.
Standardise and normalise
Ensure signals such as downtime, cycle counts, alarms, and quality checks follow a consistent data model so manufacturing KPI examples mean the same thing across assets and plants.
Visualise and alert
Build role-based manufacturing KPI dashboards with clear thresholds, trend lines, and alerts for deviations.
Apply AI for detection and guidance
Use AI to identify patterns behind KPI shifts, such as recurring micro-stops, combinations of settings that drive defects, or early signs of failure, and guide teams to specific actions.
This is where platforms like Intelycx bring everything together: machine connectivity, standardised data, and AI-driven insights in one environment. Instead of stitching together disparate tools, manufacturers get a single place to track and improve their most important KPIs.
How Intelycx Helps Turn Manufacturing KPIs into Daily Guidance
Manufacturing KPIs only create value when they are accurate, real-time, and connected to action. That is the gap Intelycx is built to close.
The Intelycx platform connects legacy and modern machines into a single data foundation, normalizes and enriches signals so KPIs are calculated consistently across lines and sites, and provides real-time dashboards for operators, engineers, and leaders. On top of this connected data, Intelycx layers AI-driven insights so teams understand not just what changed in a KPI, but why, and what to do about it.
If you are working to move beyond spreadsheets and lagging reports, a unified manufacturing AI platform like Intelycx can help you turn KPIs from static charts into a living system for maximizing production efficiency every day. You can learn more about our solutions and approach at intelycx.com.